Missing Data: Using Multiple Imputation to Conduct a Mediation Analysis in R
- Oct 8, 2017
- 3 min read
Updated: Apr 15, 2024
Easier to view code and Jupyter notebook are available on GitHub.
Multiple imputation is an extremely helpful and powerful tool when you have missing data. As a child development researcher, my data is particularly prone to missingness. Parents might not want to return to the lab, children get sleepy or fussy- it happens.
However, there are ways to successfully and accurately reduce errors and bias caused by missing data. I found an article by Enders (2012) by to be extremely helpful in explaining the benefits of imputation as opposed to case-wise deletion- which is the most common practice in developmental research.
Before going forward, I used van Buuren's article to help me create the code, think about multiple imputation on a theoretical level, and also decide which parameters to use. I highly recommend you read through his article before pursuing multiple imputation!
For a recent project, I decided to use multiple imputation. I had rates of missingness ranging from 0% to 23%. Many sources (e.g., Little & Rubin, 2002; Bodner, 2008; White, Royston, & Wood, 2011) suggest creating as many datasets as the average rate of missing. So, in my case, I had an average of 10% missing, so I created 10 imputed datasets.
**Note, if you want your results to be consistent (for sharing or publishing purposes, make sure to set your seed when imputing!)
Using 'mice' package in R was very easy, and I had little trouble generating imputed datasets or pooling them. I also found visualizing the imputed data and comparing it to the original data using the 'VIM' package to be helpful. Using 'mice' to run linear regression models was also fairly simple.
Where I ran into trouble was using 'mice' and 'lavaan' to run a mediation analysis using my imputed data sets. Here is how I solved it- I hope it helps!
First, load your libraries (download if needed). Next, read in a dataset ('airquality') and create some fake missing data. Then, have a look at the data:
Next, let's look at how much data is missing for each variable. Be wary of missing data patterns higher than 5%.
Now let's visualize our missing data:


Alright, now time to impute!!
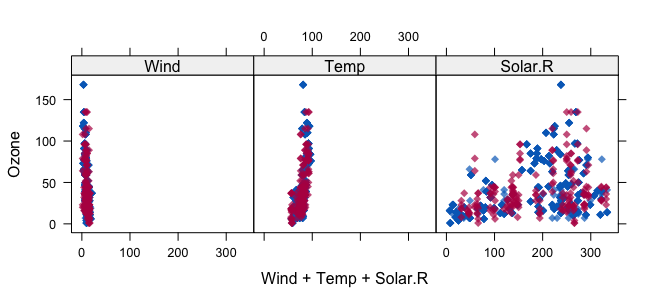
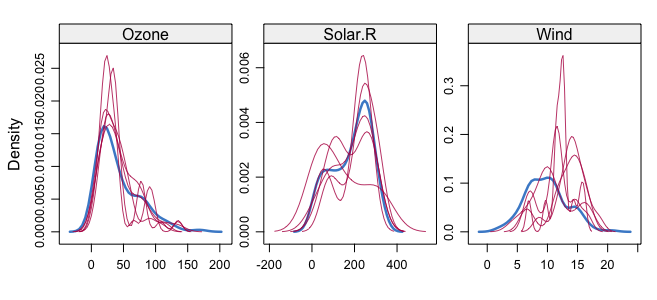
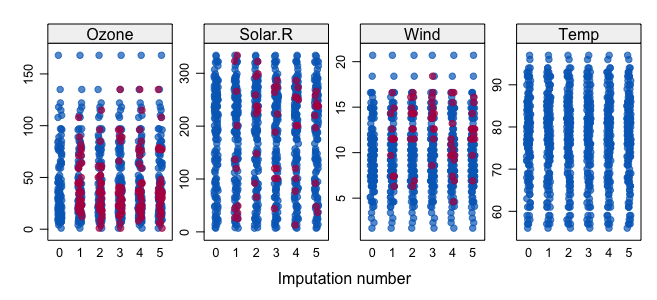
Now, let's have a look at how the new imputed data (in red) looks compared to out original data (in blue):
See the van Buren article for guidelines on how to measure goodness of fit for imputed data.


Finally- create a data frame from the imputed datasets, create your mediation model, extract and pool your parameters and check your final mediation model!!
We did it!
For the full code, see documentation here on GitHub. Click here for a copy of the Jupyter Notebook file.
Happy Imputing!
References:
1. Bodner, T. E. (2008). What improves with increased missing data imputations? Structural Equation Modeling, 15(4), 651-675. doi:http://dx.doi.org/10.1080/10705510802339072
2. Enders, C. K. (2013), Dealing With Missing Data in Developmental Research. Child Dev Perspectives, 7, 27–31. doi:10.1111/cdep.12008
3. Little, R. J., & Rubin, D. B. (2002). Single imputation methods. Statistical Analysis with Missing Data, Second Edition, 59-74. doi:http://dx.doi.org/10.1002/9781119013563
4. van Buuren, S., & Groothuis-Oudshoorn, K. (2011). mice: Multivariate Imputation by Chained Equations in R. Journal of Statistical Sotware, 45(3), 1-67. doi:http://dx.doi.org/10.18637/jss.v045.i03
5. White, I. R., Royston, P., & Wood, A. M. (2011). Multiple imputation using chained equations: issues and guidance for practice. Statistics in Medicine, 30(4), 377-399. doi:http://dx.doi.org/10.1002/sim.4067


Comments